Schools
The school location models of the land-use stage assign every student of the synthetic population to a school. They need an inventory of schools with a location and a capacity. MILES builds it from three federal collections of the National Center for Education Statistics (NCES): the Common Core of Data (public schools) and the Private School Universe Survey (private schools) [12], and the Integrated Postsecondary Education Data System (colleges and universities) [13]. The School Attendance Boundary Survey [14] gives the attendance zones of public schools. All four are public and are downloaded from the NCES web site into data/raw/nces/, data/raw/ipeds/ and data/raw/sabs/.
The inventory covers the six states with model zones: Maryland, the District of Columbia, Delaware, Pennsylvania, Virginia and West Virginia. Enrolment is taken as the capacity of a school. The inventory built from the most recent releases is used for the base year 2016 and for all later years.
Common Core of Data, public schools
School directory and school membership files of the 2024–25 school year [12], with the EDGE geocodes of public schools for coordinates and county. The membership file is in long format (one row per school, grade and student group); MILES reads the school totals and the counts by grade.
Codebook
| Variable | Description | Type | Values / categories / units | Used in |
|---|---|---|---|---|
NCESSCH |
NCES school identifier (12 digits; first 7 = district LEAID) |
string | — | Inventory; SABS link |
FIPST |
State FIPS code | string | 10, 11, 24, 42, 51, 54 kept | Filter |
SY_STATUS_TEXT |
Operational status in the school year | category | Open, New, Reopened kept; Closed, Inactive, Future dropped | Filter |
SCH_NAME, LEA_NAME |
School and district name | string | — | Inventory (labels) |
GSLO, GSHI |
Lowest and highest grade offered | category | PK, KG, 01–13, UG | Inventory |
LEVEL |
School level | category | Elementary, Middle, High, Prekindergarten, Other, Not applicable | Grade band when no graded counts |
GRADE |
Grade of a membership row | category | Pre-Kindergarten, Kindergarten, Grade 1–13, Ungraded, Adult Education | Enrolment by band |
STUDENT_COUNT |
Students in the row | integer | students | Capacity |
TOTAL_INDICATOR |
Level of aggregation of a membership row | category | Education Unit Total; Subtotal 4 - By Grade kept | Filter |
LAT, LON |
School coordinates (EDGE geocode file) | float | degrees, WGS 84 | Zone assignment |
CNTY, NMCNTY |
County FIPS and name (EDGE geocode file) | string | — | County tables |
Statistics
The national directory has 102,178 records. Records and students of the six states, 2024–25 (students from the state membership file):
| State | Directory records | Open, new or reopened | Students incl. PK | Students K–12 |
|---|---|---|---|---|
| Maryland | 1,414 | 1,408 | 891,525 | 859,450 |
| District of Columbia | 247 | 245 | 100,335 | 88,294 |
| Delaware | 238 | 236 | 142,156 | 139,425 |
| Pennsylvania | 2,949 | 2,932 | 1,691,456 | 1,682,241 |
| Virginia | 2,159 | 2,126 | 1,257,315 | 1,223,117 |
| West Virginia | 701 | 676 | 242,155 | 227,606 |
| Total | 7,708 | 7,623 | 4,324,942 | 4,220,133 |
Of the open, new or reopened schools, 4,328 are elementary, 1,281 are middle, 1,520 are high, 161 are other, 66 are prekindergarten schools (CCD LEVEL).
Private School Universe Survey
Public-use file of the 2023–24 survey [12]: one record per private school with enrolment by grade and coordinates. The survey weight PFNLWT corrects for non-response; the inventory uses the unweighted records, since it needs actual schools.
Codebook
| Variable | Description | Type | Values / categories / units | Used in |
|---|---|---|---|---|
PPIN |
Private school identifier | string | — | Inventory |
PINST |
School name | string | — | Inventory (labels) |
PSTANSI |
State FIPS code | string | six states kept | Filter |
PCNTY24, PCNTNM |
County code and name | string | — | County tables |
LATITUDE24, LONGITUDE24 |
Coordinates; EDGE private-school geocodes where missing | float | degrees | Zone assignment |
NUMSTUDS |
Students, kindergarten to grade 12 | integer | students | Capacity |
P150 |
Prekindergarten students | integer | students | Kept apart (not in capacity) |
P160–P280 |
Students in kindergarten and grades 1–12 | integer | students | Split of capacity by band |
P290, P300 |
Ungraded students | integer | students | Follow the graded split |
LOGR2024, HIGR2024 |
Lowest and highest grade | category | 1 ungraded, 2 PK, 3 K, 4–15 grades 1–12, 16 grade 13 | Inventory |
LEVEL |
School level | category | 1 elementary, 2 secondary, 3 combined | Band when no graded counts |
PFNLWT |
Final survey weight | float | — | State totals (check) |
Statistics
The national file has 22,510 records. Six states, 2023–24:
| State | Schools | Students K–12 | Schools, weighted | Students, weighted | Without coordinates |
|---|---|---|---|---|---|
| Maryland | 543 | 101,509 | 725 | 134,249 | 0 |
| District of Columbia | 50 | 13,869 | 70 | 25,508 | 0 |
| Delaware | 74 | 11,532 | 120 | 15,688 | 0 |
| Pennsylvania | 1,567 | 177,942 | 2,226 | 243,192 | 0 |
| Virginia | 651 | 99,127 | 882 | 132,128 | 0 |
| West Virginia | 100 | 8,994 | 133 | 11,197 | 0 |
| Total | 2,985 | 412,973 | 4,155 | 561,961 | 0 |
Among the 2,985 private schools with students, enrolment has median 58, mean 138.3 and maximum 8,873 students.
Integrated Postsecondary Education Data System
Institutional characteristics 2024 (HD2024), fall enrolment 2023 (EF2023A) and 12-month enrolment 2023–24 (EFFY2024) [13]. Each institution is one point; branch campuses with their own identifier are separate points.
Codebook
| Variable | Description | Type | Values / categories / units | Used in |
|---|---|---|---|---|
UNITID |
Institution identifier | string | — | Inventory; link of the three files |
INSTNM |
Institution name | string | — | Inventory (labels) |
FIPS |
State FIPS code | string | six states kept | Filter |
CYACTIVE |
Institution active in the current year | category | 1 kept | Filter |
COUNTYCD, COUNTYNM |
County FIPS and name | string | — | County tables |
LATITUDE, LONGITUD |
Coordinates | float | degrees | Zone assignment |
SECTOR |
Control and level | category | 1 public 4-year, 2 private non-profit 4-year, 3 private for-profit 4-year, 4–9 two-year and less | College model size terms (public 4-year, private 4-year, other) |
EFALEVEL, EFTOTLT |
Fall enrolment, level 1 = all students, total | integer | students | Capacity |
EFFYALEV, EFYTOTLT |
12-month unduplicated headcount, all students | integer | students | Capacity where fall enrolment is missing (× 0.8) |
Statistics
The national file has 6,072 institutions. Six states:
| State | Institutions | Active | Active with fall enrolment | Fall enrolment 2023 |
|---|---|---|---|---|
| Maryland | 78 | 78 | 75 | 350,718 |
| District of Columbia | 23 | 23 | 22 | 100,557 |
| Delaware | 18 | 16 | 15 | 60,884 |
| Pennsylvania | 315 | 307 | 304 | 649,860 |
| Virginia | 147 | 144 | 139 | 564,465 |
| West Virginia | 68 | 68 | 68 | 137,024 |
| Total | 649 | 636 | 623 | 1,863,508 |
Active institutions with fall enrolment by sector, six states:
| Sector | Institutions | Fall enrolment | Share of enrolment (%) |
|---|---|---|---|
| Public, 4-year or above | 86 | 757,132 | 40.6 |
| Private non-profit, 4-year or above | 182 | 602,552 | 32.3 |
| Private for-profit, 4-year or above | 28 | 95,335 | 5.1 |
| Public, 2-year | 72 | 366,087 | 19.6 |
| Private non-profit, 2-year | 24 | 6,093 | 0.3 |
| Private for-profit, 2-year | 63 | 17,425 | 0.9 |
| Public, less than 2-year | 46 | 3,470 | 0.2 |
| Private non-profit, less than 2-year | 8 | 1,048 | 0.1 |
| Private for-profit, less than 2-year | 114 | 14,366 | 0.8 |
School Attendance Boundary Survey
Attendance zones of public schools for the 2015–16 school year [14], as four polygon layers (primary, middle, high, other). It is the latest collection; no later release exists. Boundaries are linked to the inventory by ncessch.
Codebook
| Variable | Description | Type | Values / categories / units | Used in |
|---|---|---|---|---|
ncessch |
NCES school identifier | string | 12 digits | Link to the inventory |
leaid |
District identifier | string | 7 digits | District coverage |
gslo, gshi |
Lowest and highest grade served by the boundary | category | PK, KG, 01–12 | Band test grades 3, 7, 10 |
stAbbrev |
State | string | — | Filter |
openEnroll |
District has open enrolment | category | 0 no, 1 yes | District coverage table |
| geometry | Attendance zone polygon | polygon | EPSG:3857 | In-boundary share of zone housing units |
Statistics
The national file has 75,128 boundary polygons. Polygons by state and layer:
| State | Primary | Middle | High | Other | All |
|---|---|---|---|---|---|
| Maryland | 855 | 227 | 189 | 15 | 1,286 |
| District of Columbia | 77 | 12 | 9 | 2 | 100 |
| Delaware | 113 | 46 | 33 | 1 | 193 |
| Pennsylvania | 1,507 | 491 | 517 | 45 | 2,560 |
| Virginia | 1,101 | 332 | 297 | 16 | 1,746 |
| West Virginia | 312 | 88 | 76 | 6 | 482 |
| Total | 3,965 | 1,196 | 1,121 | 85 | 6,367 |
Share of public enrolment of the inventory whose school has a boundary covering the band's test grade (grade 3 elementary, 7 middle, 10 high). A district counts as covered at 90 % or more:
| State | Elementary, % (districts covered) | Middle | High |
|---|---|---|---|
| Maryland | 90.8 (17 of 24) | 90.7 (19 of 25) | 90.9 (18 of 25) |
| District of Columbia | 55.3 (1 of 44) | 39.9 (0 of 37) | 39.2 (0 of 23) |
| Delaware | 72.3 (6 of 32) | 67.0 (8 of 36) | 64.0 (14 of 31) |
| Pennsylvania | 72.1 (42 of 95) | 70.4 (43 of 97) | 81.6 (75 of 104) |
| Virginia | 92.2 (13 of 21) | 83.1 (14 of 21) | 93.8 (19 of 21) |
| West Virginia | 31.7 (2 of 11) | 39.0 (4 of 11) | 43.7 (6 of 10) |
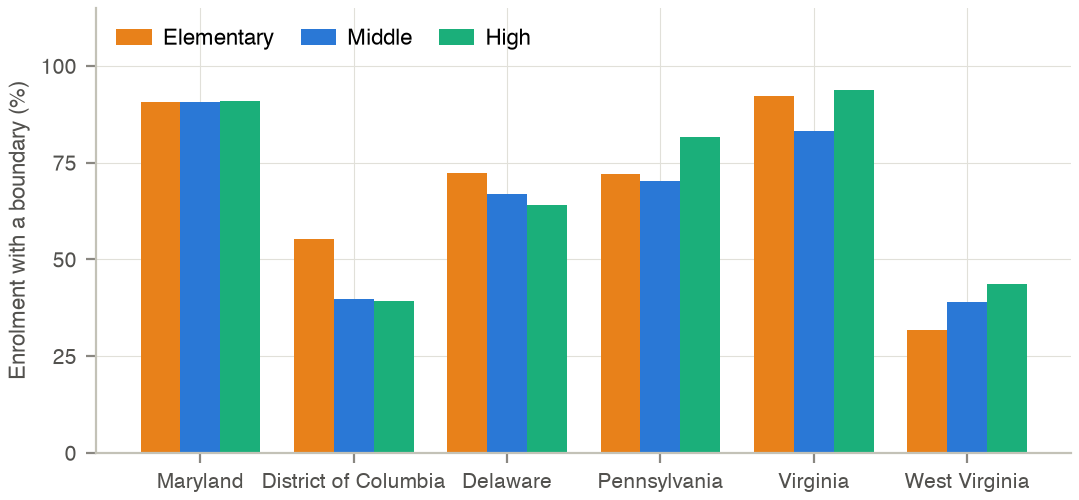
Share of public enrolment of the inventory whose school has an attendance boundary in the 2015–16 survey, by state and grade band.
School inventory used by MILES
The three collections are combined into one file, one record per school and grade band (schools.csv of the land-use input). Its columns:
| Variable | Description | Type | Values / categories / units | Used in |
|---|---|---|---|---|
id |
Record identifier | integer | 1… | Land use, activities |
zone |
Model zone of the school point | integer | 1–1,588 (MSTM zone) | School location; activities |
type |
School type of the land-use model | integer | 1 primary, 2 secondary, 3 tertiary | Land use |
capacity |
Enrolment of the band | integer | students | Size term; capacity constraint |
coordX, coordY |
Coordinates | float | m, EPSG:26918 | Activities |
startTime, duration |
School day | integer | seconds after midnight; seconds | Activities |
band |
Grade band | category | elementary (K–5), middle (6–8), high (9–12), postsec | School location segments |
sector |
Control | category | public, private, postsec | Size terms |
source, source_id |
Source file and identifier | string | CCD, PSS or IPEDS | Links to the sources |
state_fips, county_fips |
State and county | string | FIPS | Tables |
pk_enrollment |
Prekindergarten students (not in capacity) | integer | students | Reporting |
Statistics
6,749 records of 4,452 schools and institutions in 1,199 of the 1,588 zones. Capacity per record:
| Type | Records | Schools | Capacity | Mean | Median | Maximum |
|---|---|---|---|---|---|---|
| Public, elementary | 2,009 | 2,009 | 843,101 | 420 | 416 | 1,459 |
| Public, middle | 1,009 | 1,009 | 437,050 | 433 | 287 | 1,702 |
| Public, high | 611 | 611 | 618,515 | 1,012 | 933 | 4,655 |
| Private K–12 | 2,928 | 1,255 | 205,311 | 70 | 35 | 7,546 |
| Post-secondary | 192 | 192 | 750,572 | 3,909 | 583 | 60,084 |
| All | 6,749 | 4,452 | 2,854,549 | 423 | 158 | 60,084 |
Capacity by state. The last column compares public K–12 capacity with the NCES state total. Pennsylvania, Virginia and West Virginia are only partly inside the zone system; in the District of Columbia the difference comes from the schools dropped in processing (see below):
| State | Public K–12 | Private K–12 | Post-secondary | Public K–12 ÷ NCES state total (%) |
|---|---|---|---|---|
| Maryland | 859,450 | 101,508 | 350,718 | 100.0 |
| District of Columbia | 82,062 | 13,868 | 100,592 | 92.9 |
| Delaware | 139,425 | 11,533 | 60,884 | 100.0 |
| Pennsylvania | 274,976 | 28,586 | 53,870 | 16.3 |
| Virginia | 500,238 | 48,720 | 121,264 | 40.9 |
| West Virginia | 42,515 | 1,096 | 63,244 | 18.7 |
Maryland by county (* study area):
| County | K–12 schools | Public elementary | Public middle | Public high | Private K–12 | Post-secondary | Institutions |
|---|---|---|---|---|---|---|---|
| Allegany | 28 | 3,444 | 1,779 | 2,417 | 701 | 6,740 | 2 |
| Anne Arundel * | 167 | 37,101 | 18,871 | 26,381 | 10,082 | 16,864 | 7 |
| Baltimore City * | 205 | 34,262 | 16,874 | 22,254 | 11,342 | 65,575 | 13 |
| Baltimore County * | 258 | 48,013 | 23,621 | 34,310 | 21,205 | 56,587 | 14 |
| Calvert | 29 | 6,191 | 3,521 | 4,837 | 728 | 0 | 0 |
| Caroline | 11 | 2,351 | 1,217 | 1,766 | 59 | 0 | 0 |
| Carroll * | 56 | 11,652 | 5,922 | 8,085 | 1,645 | 6,046 | 2 |
| Cecil | 36 | 6,175 | 3,260 | 4,630 | 1,132 | 1,845 | 1 |
| Charles | 45 | 11,368 | 6,201 | 9,436 | 1,513 | 4,984 | 1 |
| Dorchester | 14 | 1,944 | 979 | 1,337 | 68 | 0 | 0 |
| Frederick | 85 | 20,730 | 10,637 | 15,101 | 2,010 | 11,540 | 4 |
| Garrett | 13 | 1,427 | 746 | 1,020 | 62 | 701 | 1 |
| Harford * | 72 | 16,653 | 8,400 | 11,553 | 3,079 | 5,192 | 2 |
| Howard * | 112 | 24,318 | 13,287 | 18,428 | 4,884 | 10,386 | 4 |
| Kent | 9 | 726 | 354 | 511 | 378 | 916 | 1 |
| Montgomery | 339 | 67,074 | 35,567 | 52,150 | 24,095 | 20,445 | 6 |
| Prince George's | 247 | 57,546 | 29,300 | 40,456 | 10,565 | 121,212 | 9 |
| Queen Anne's | 18 | 3,212 | 1,645 | 2,298 | 537 | 1,980 | 1 |
| Somerset | 7 | 1,245 | 597 | 777 | 0 | 2,844 | 1 |
| St. Mary's | 43 | 7,276 | 3,765 | 5,341 | 2,080 | 1,587 | 1 |
| Talbot | 12 | 1,835 | 896 | 1,435 | 807 | 0 | 0 |
| Washington | 58 | 9,732 | 5,000 | 6,935 | 2,065 | 5,565 | 2 |
| Wicomico | 35 | 7,169 | 3,131 | 4,525 | 1,587 | 9,709 | 3 |
| Worcester | 16 | 2,722 | 1,504 | 2,227 | 884 | 0 | 0 |
| Maryland | 1,915 | 384,166 | 197,074 | 278,210 | 101,508 | 350,718 | 75 |
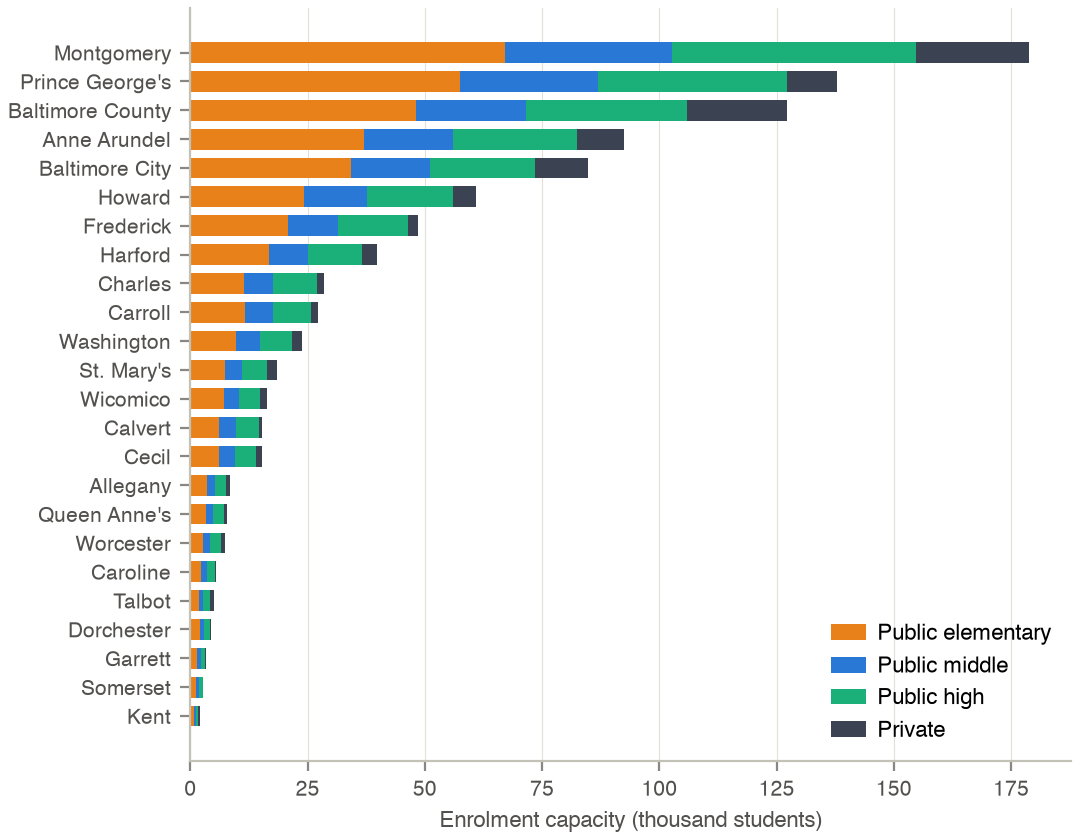
Kindergarten to grade 12 enrolment capacity of the inventory by Maryland county, band and sector.
Processing
- Public schools: schools closed, inactive or not yet open are dropped, and so are schools without coordinates or students. Students by grade are summed to the bands K–5, 6–8 and 9–12; ungraded students follow the graded split of the school, or the CCD level where no graded counts exist. Prekindergarten is kept apart, as the synthetic students start at age 5.
- Private schools: the K–12 total
NUMSTUDSis split over the bands by the graded counts. Missing coordinates are taken from the EDGE private-school geocodes. - Post-secondary: active institutions; capacity is fall 2023 enrolment, or 0.8 × the 12-month headcount where fall enrolment is missing.
- A record is kept for each band with at least one student. Points are placed in the model zones (point in polygon, EPSG:26918); Maryland schools outside every polygon go to the nearest zone; schools of other states outside the zone system are dropped.
- The school day by band (start, duration) is the median of school trips of the 2017/18 Regional Travel Survey: elementary 08:35 and 7.0 h, middle 08:00 and 7.1 h, high 07:45 and 7.2 h, post-secondary 09:15 and 4.5 h.
- Attendance boundaries: census-block housing units are placed in the boundaries covering the band's test grade and in the zones; the share of a zone's housing units inside a school's boundary enters the K–8 and high-school location models.
- Code:
landuse/schools/build_inventory.py,attendance_boundaries.py,school_data.py.