Traffic
The 2024 assignment against the MDOT SHA counts (average annual weekday traffic, AAWDT), the FHWA continuous count stations (TMAS), the screenlines and the MDOT SHA mileage. The assignment carries only the residents' cars with a tour touching the six counties: trucks, commercial vehicles and through traffic are not simulated, so ratios below 1 are expected, most of all off-peak and on roads with much freight. No count was used to set any speed or capacity. Model: mean of five assignment seeds.
Open the interactive validation map
How to read the figures
Orange: model; dark grey: counts. Bands and error bars: range of the five assignment seeds. Ratios are model ÷ count.
Counts at every station
Stations are matched to network links by road identity; 3,437 of 3,797 stations are matched unambiguously, 2,308 of them on the mainline. Every interstate station, including the Baltimore Beltway (I-695) and the Capital Beltway (I-495), is listed in Interstates by station.
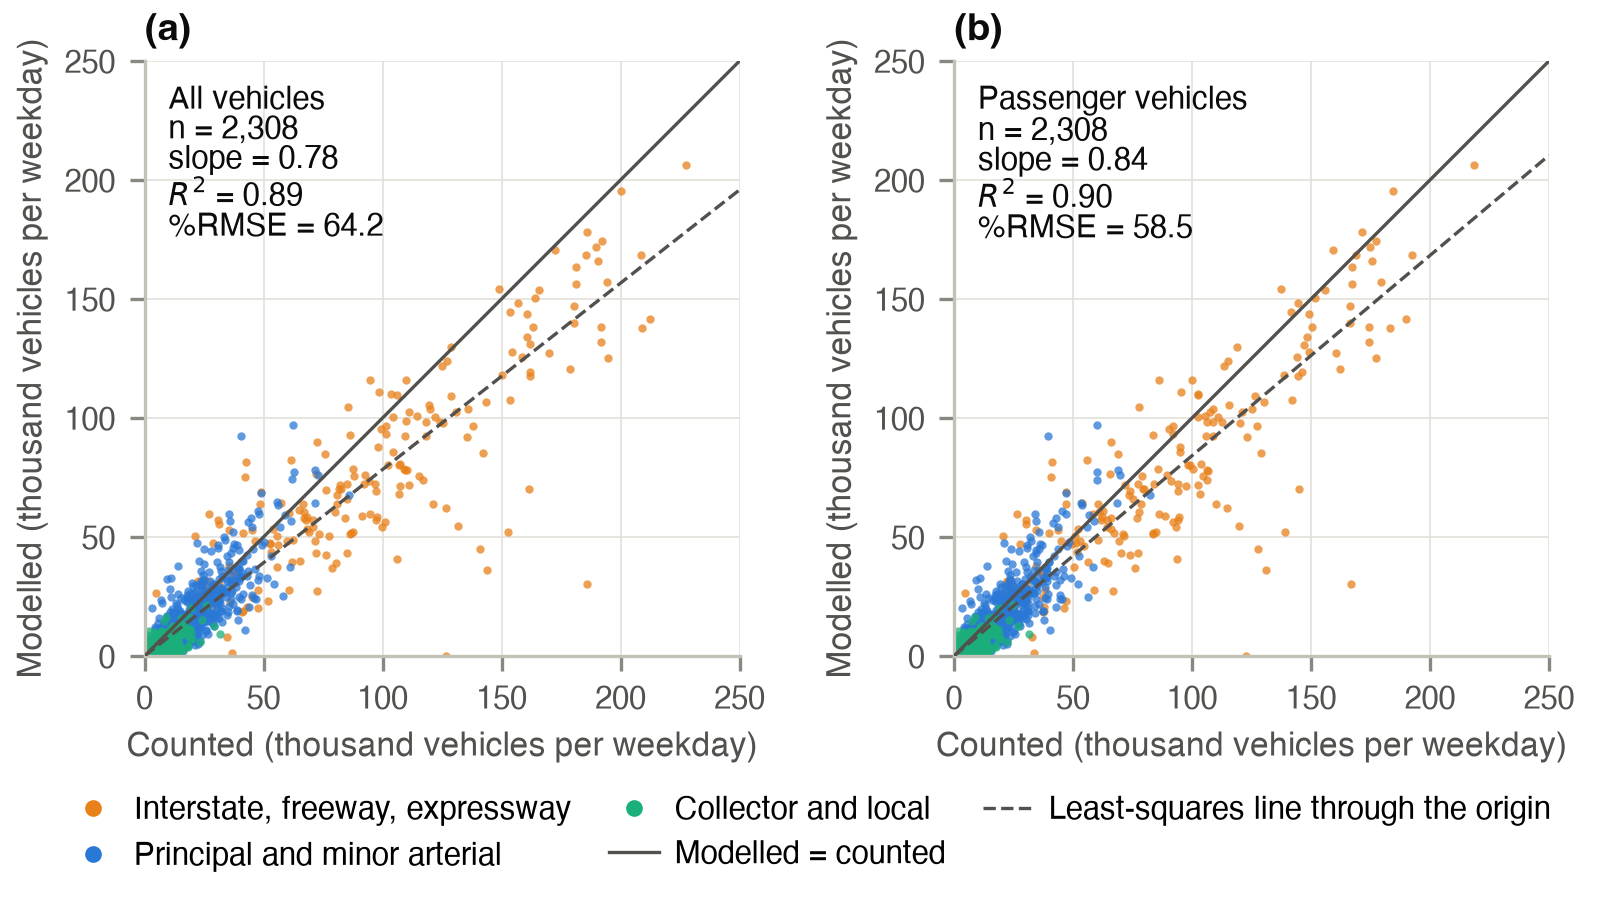
Across stations the modelled volumes follow the counts with R² = 0.89 and a slope of 0.78 for all vehicles and R² = 0.90 and a slope of 0.84 for passenger vehicles. Two random halves of the stations give the same ratio (0.77 and 0.77).
| Facility class | Stations | Tolerance (%) | Model ÷ count, all | Model ÷ count, passenger | %RMSE, all | %RMSE, passenger |
|---|---|---|---|---|---|---|
| Interstate I-695 | 41 | ±7 | 0.84 | 0.91 | 18.9 | 14.3 |
| Other interstate | 77 | ±7 | 0.72 | 0.80 | 40.8 | 36.3 |
| Other freeway or expressway | 82 | ±7 | 0.86 | 0.88 | 38.3 | 37.5 |
| Principal arterial | 323 | ±15 | 0.93 | 0.96 | 37.7 | 38.7 |
| Minor arterial | 601 | ±15 | 0.69 | 0.71 | 52.5 | 51.8 |
| Major collector | 801 | ±25 | 0.58 | 0.60 | 68.4 | 67.4 |
| Minor collector or local | 383 | ±25 | 0.60 | 0.63 | 82.6 | 81.6 |
| All classes | 2,308 | – | 0.77 | 0.81 | 64.2 | 58.5 |
Mainline count stations of the six counties; ratio: model ÷ count of the summed volumes. Counts: MDOT SHA 2024 AAWDT, both directions; passenger vehicles: count × (1 − truck and bus share of the station's classification counts, or of its class where the station has none). Model: link volumes of residents' cars, mean of the last five iterations, scaled from the 10 % sample. Tolerance: model ÷ count band by facility class (FDOT, 2008).
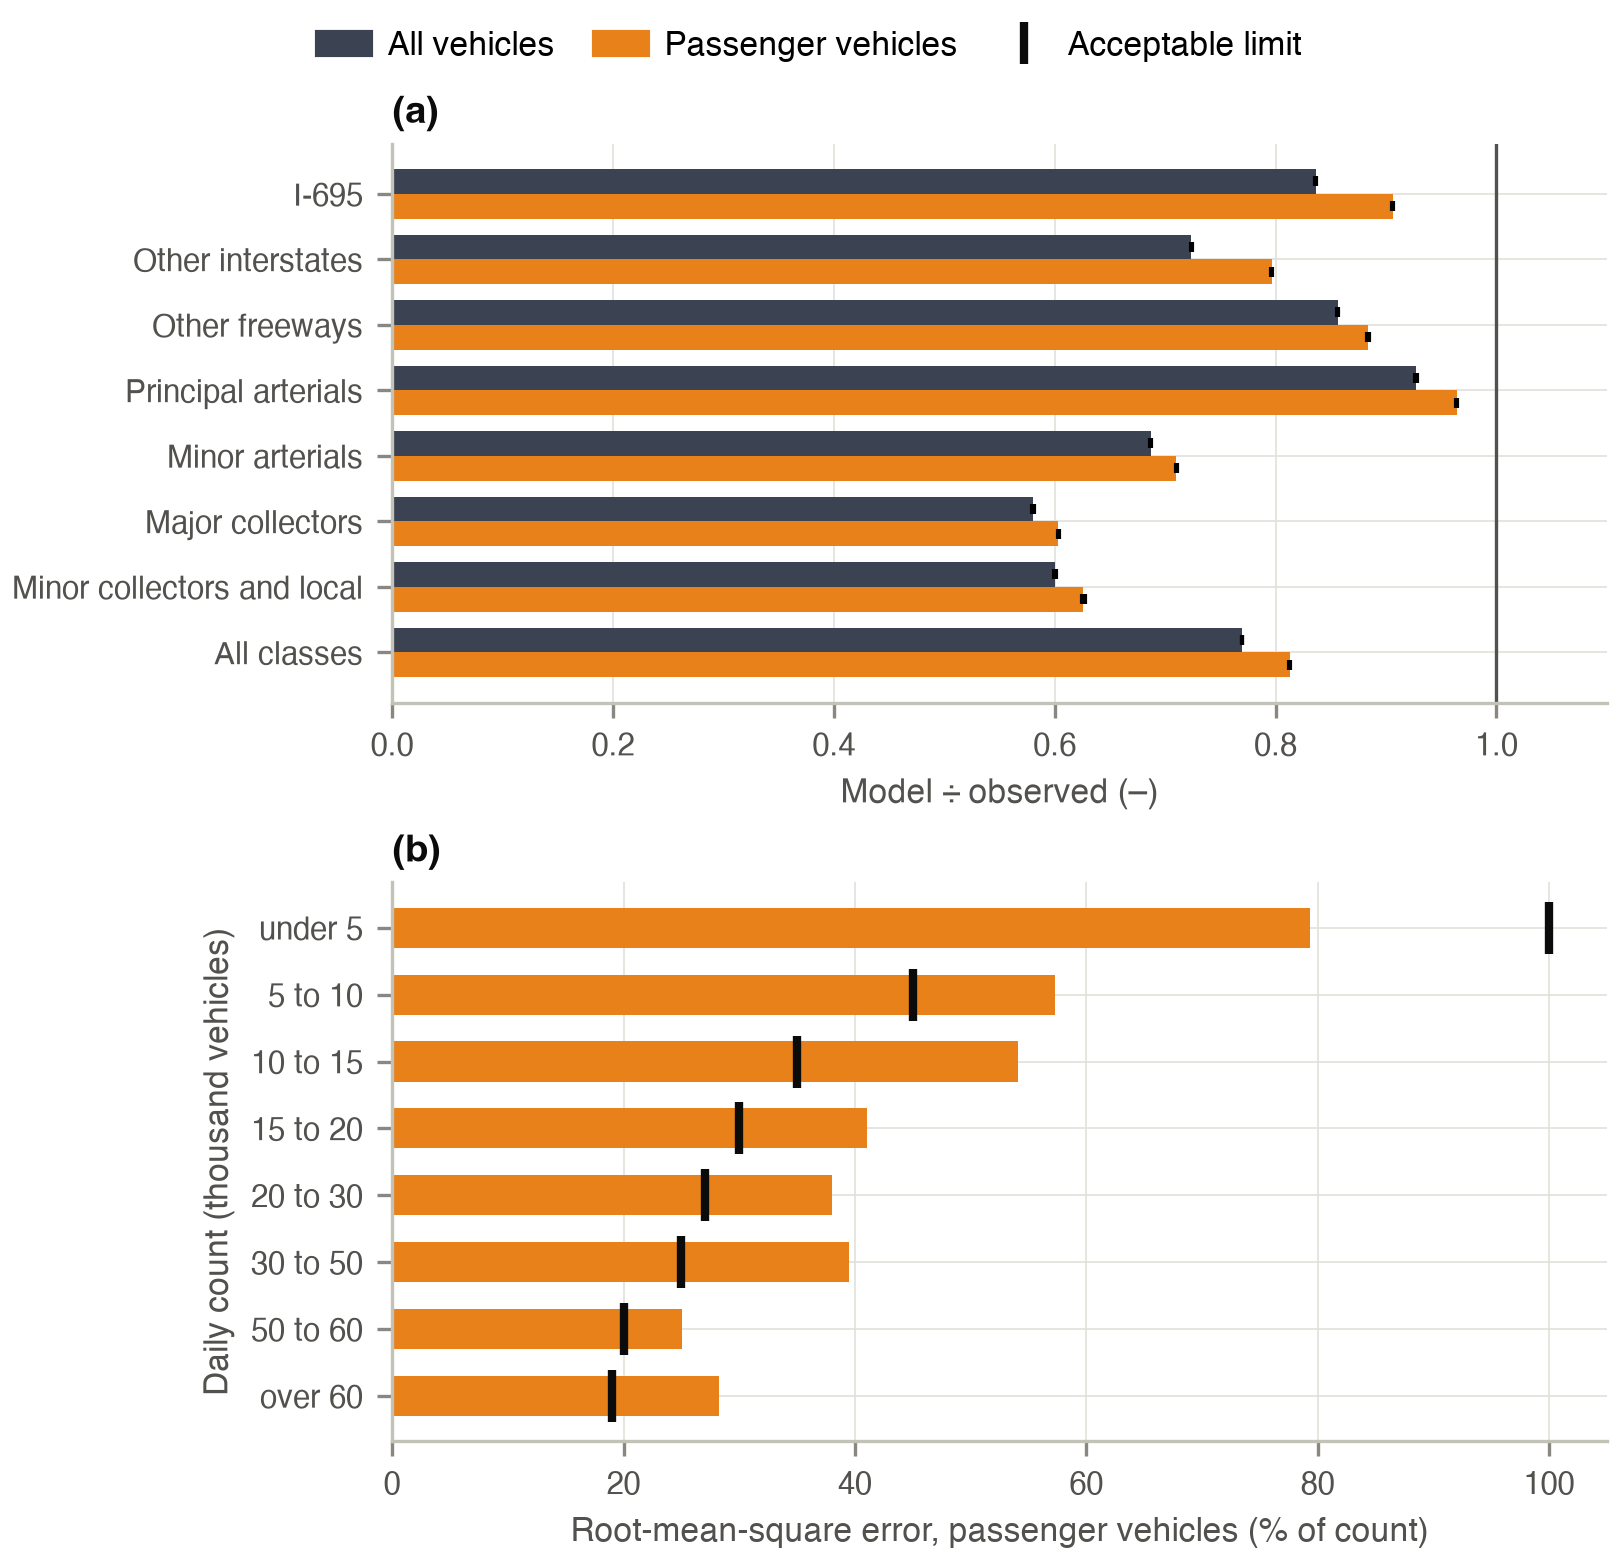
On I-695, other freeways and principal arterials the model carries 0.84 to 0.93 of all vehicles and 0.88 to 0.96 of passenger vehicles, and principal arterials are within their tolerance; on minor arterials and collectors it carries 0.58 to 0.69. Only the volume group below 5,000 vehicles a day meets the %RMSE guideline.
Through the day
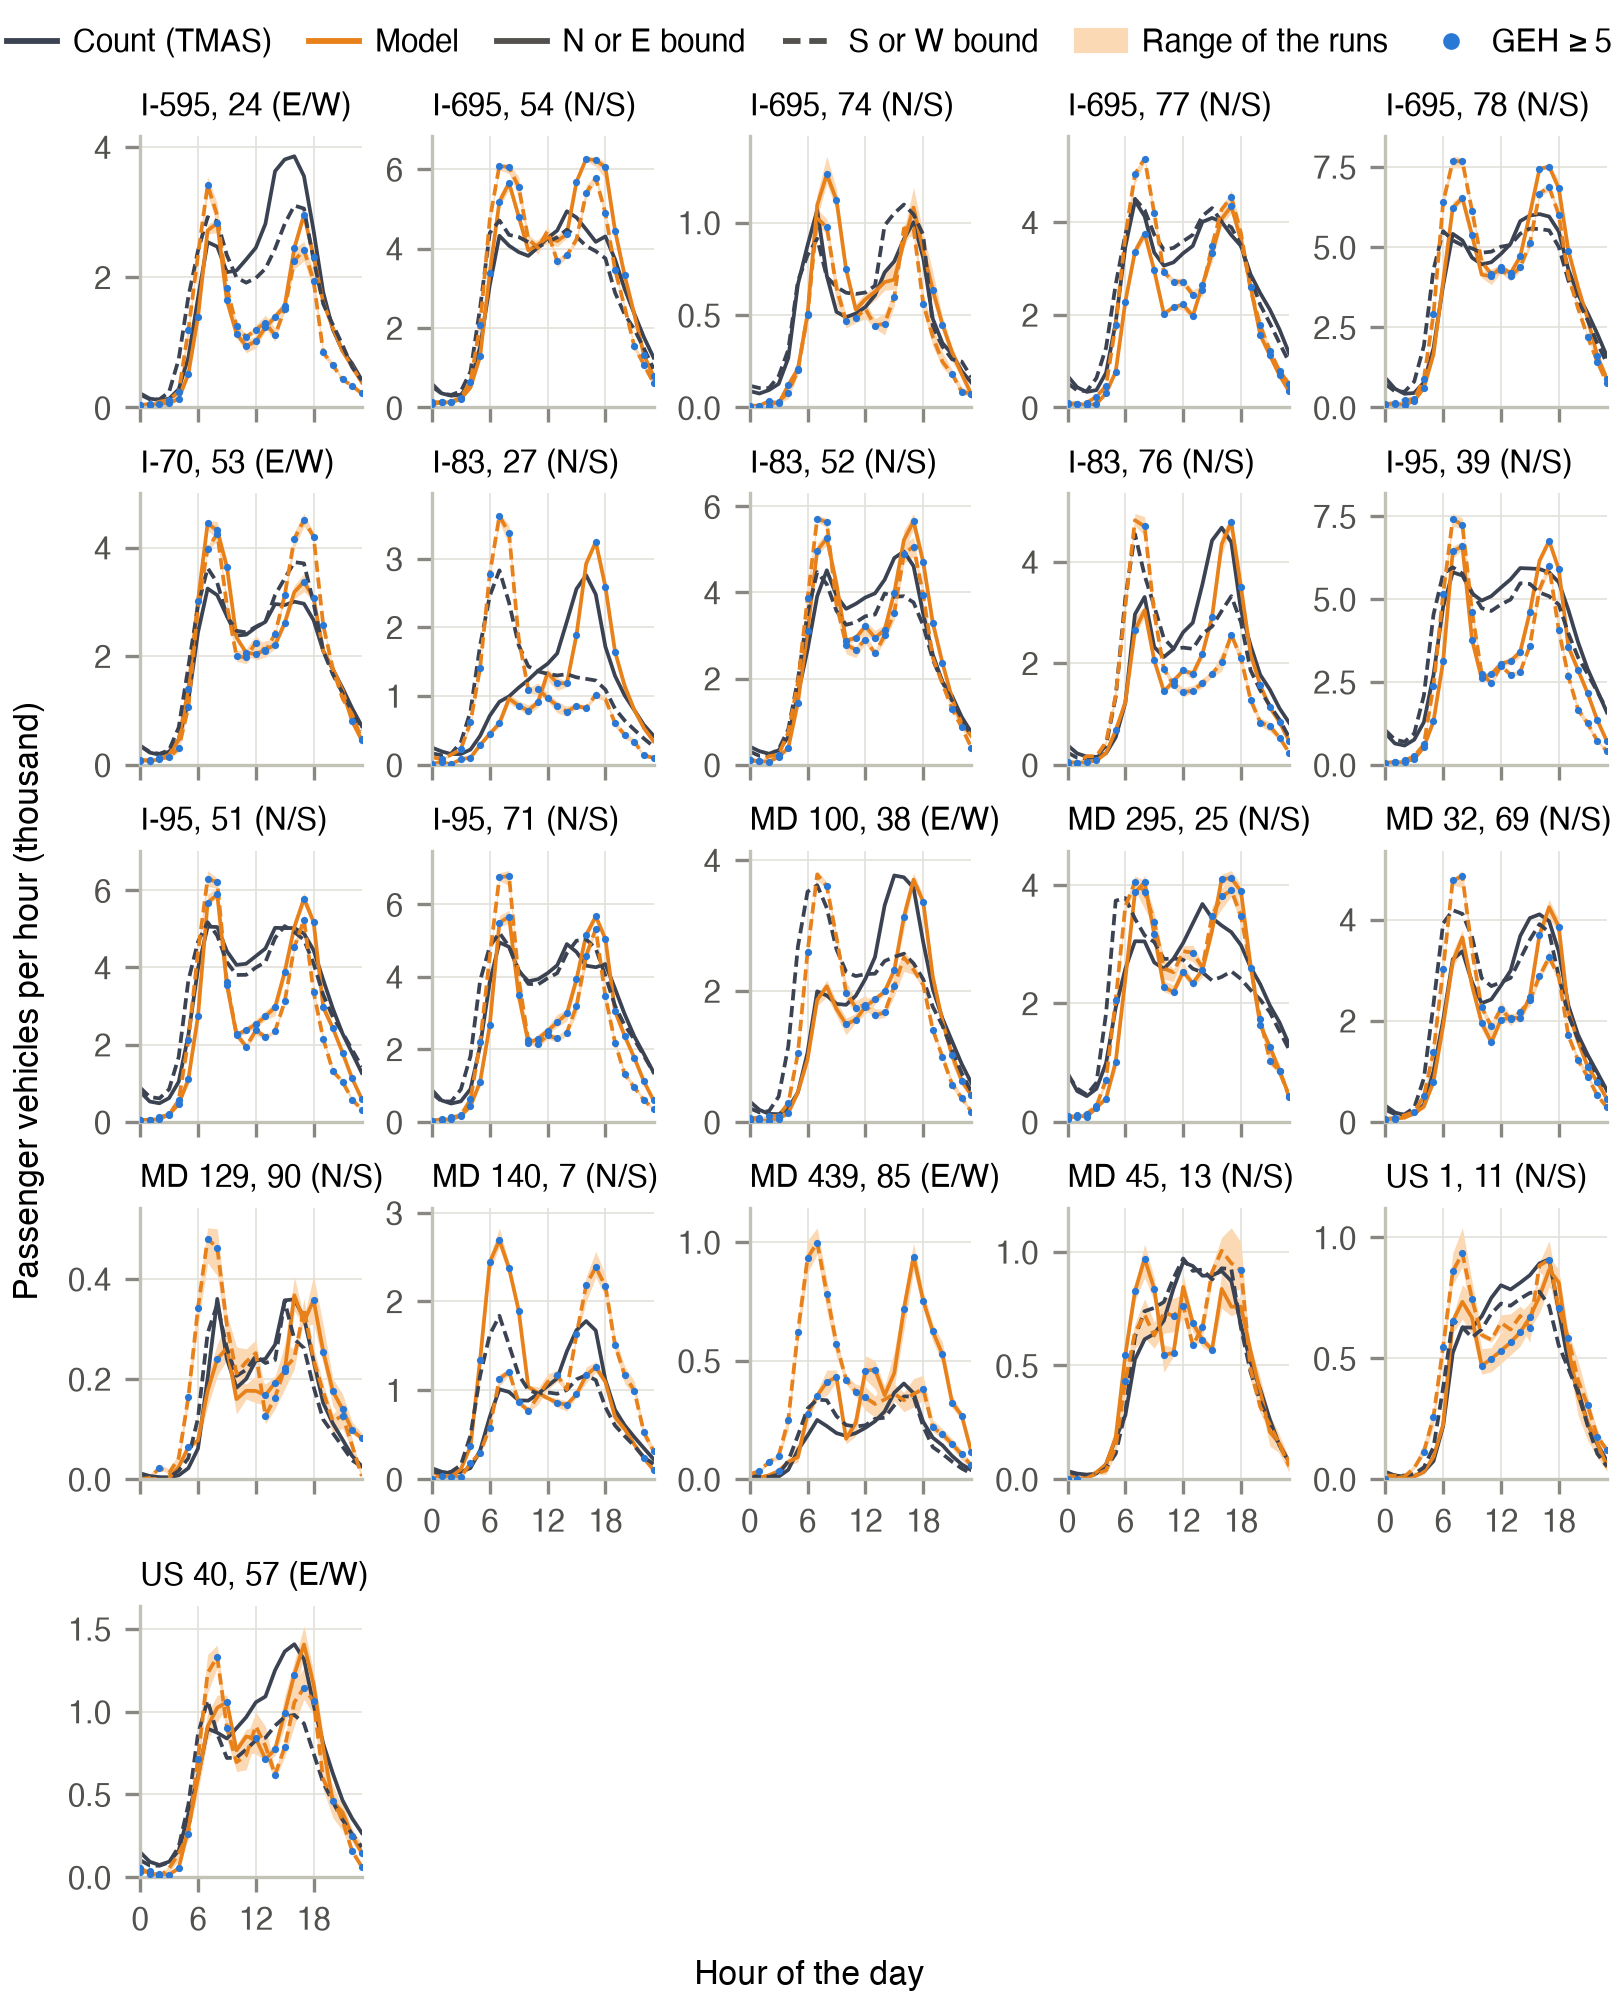
The 21 of the 25 TMAS continuous count stations of the six counties with complete 2024 weekdays (42 station directions): 15 freeway stations and 6 arterial and collector stations.
| Period | Model ÷ count, freeways | Other | All | GEH < 5 (%), freeways | Other | All |
|---|---|---|---|---|---|---|
| Morning peak, 6:00–10:00 | 1.09 | 1.34 | 1.11 | 30 | 29 | 30 |
| Midday, 10:00–15:00 | 0.72 | 0.87 | 0.73 | 13 | 50 | 24 |
| Evening peak, 15:00–19:00 | 1.02 | 1.11 | 1.03 | 22 | 48 | 30 |
| Evening, 19:00–24:00 | 0.77 | 1.26 | 0.80 | 25 | 47 | 31 |
| Night, 0:00–6:00 | 0.48 | 0.98 | 0.50 | 11 | 57 | 24 |
| Whole day | 0.88 | 1.10 | 0.89 | 19 | 47 | 27 |
Observed: average weekday of 2024 by station, direction and hour, Monday to Friday without federal holidays, days with every lane reporting all 24 hours, converted to passenger vehicles with the station's truck and bus shares. Ratio: model ÷ count of the volumes summed over the stations and hours of the period. GEH < 5: share of the station-direction-hours of the period (guideline: 85 %). Source: FHWA Travel Monitoring Analysis System 2024.
The commute peaks, when residents' travel dominates, are reproduced; the gaps lie where the unmodelled trucks, commercial vehicles and through traffic carry more of the traffic. Neither a class-based coding of speeds and capacities (all-class ratio within 0.01) nor matching stations by proximity alone (ratios by class within 0.03) changes the result.
Screenlines
Seven screenlines were placed on the region's rivers, county lines and cordons before any model result was read. The table shows the four whose counted crossings carry at least 70 % of the motorway, trunk and primary capacity crossing them; the southern regional boundary, the Little Gunpowder Falls and the rest of the regional boundary have less count coverage.
| Screenline | Counted crossings | Count, all vehicles (thousand) | Model ÷ count, all | Model ÷ count, passenger | Maximum deviation (%) |
|---|---|---|---|---|---|
| S1 Baltimore City cordon | 67 | 1,561 | 0.77 | 0.82 | ±10 |
| S2 Patapsco River | 21 | 941 | 0.89 | 0.97 | ±10 |
| Harbor and tidal river | 9 | 455 | 1.02 | 1.10 | ±10 |
| Upper river | 12 | 486 | 0.77 | 0.84 | ±10 |
| S3 Beltway cordon | 55 | 1,649 | 0.73 | 0.77 | ±10 |
| S6 Carroll County line | 12 | 203 | 0.93 | 1.01 | ±10 |
Counted: a matched mainline count station on the same road within 3 km of the line (6 km on motorways and trunk roads); count and model are compared on the counted crossings only. Maximum deviation of a screenline total by its volume (Wegmann, 2016; FDOT, 2008).
Regional traffic
| Measure | Model | Observed | Fit |
|---|---|---|---|
| Weekday passenger-vehicle miles, six counties (million) | 54.8 | 69.3 | ratio 0.79; MAPE 20 % (counties) |
| Travel time to work, all modes (distribution) | 40.0 min | 29.3 min | TVD 15.2 pp |
| Travel time to work, drivers alone (distribution) | 26.7 min | 28.9 min | TVD 17.0 pp |
| Time leaving home for work, share 6:00–8:59 (distribution) | 65 % | 62 % | TVD 8.9 pp |
| Means of transport to work, public transport share (5 classes) | 8.3 % | 4.2 % | TVD 6.4 pp |
| Morning-peak car time, assigned vs. upstream skim (mean) | 23.3 min | 28.4 min | median ratio 0.78; 51 % within ±25 % |
| Weekday boardings, five MTA modes (thousand): NTD 2024 / 2017/18 equivalent | 456 | 174 / 255 | ratio 2.62 / 1.79 |
| Car-driver trip distance (distribution) | 15.3 km | 14.4 km | TVD 9.6 pp |
| Car-driver trip time (distribution) | 15.5 min | 22.0 min | TVD 21.7 pp |
| Passenger vehicles at 2,308 mainline count stations (sum, million) | 31.0 | 38.1 | gap 19 % |
| Home-to-work county flows (shares by home county) | 975 k | 1,380 k | TVD 5.7 pp; R² 0.98 |
Model: Maryland residents with a tour touching the region, mean of five assignment seeds. Observed: MDOT SHA 2024 vehicle miles, converted to weekday passenger vehicles with the region's count stations; ACS 2024 and 2020–2024; NTD 2024 average typical weekday boardings and their 2017/18 equivalent; travel survey 2017/18 (weighted); ACS 2016–2020 county-to-county flows.
The residents carry 0.79 of the weekday passenger-vehicle miles of the six counties, between 0.73 (Howard) and 0.95 (Carroll) by county and between 0.55 (collectors) and 0.92 (principal arterials) by road class. The modelled transit boardings are 2.6 times the NTD 2024 count and 1.8 times its 2017/18 equivalent, the period of the survey on which the mode choice is estimated (local bus 2.1, light rail 2.3, Metro subway 1.3, MARC and commuter bus 0.5). Transit carries 3.5 % of the residents' trips against 3.2 % in the survey, with 1.72 boardings per transit trip. The assigned morning-peak car times are a median 0.78 of the fixed skim times on which the land-use and activity models chose locations.
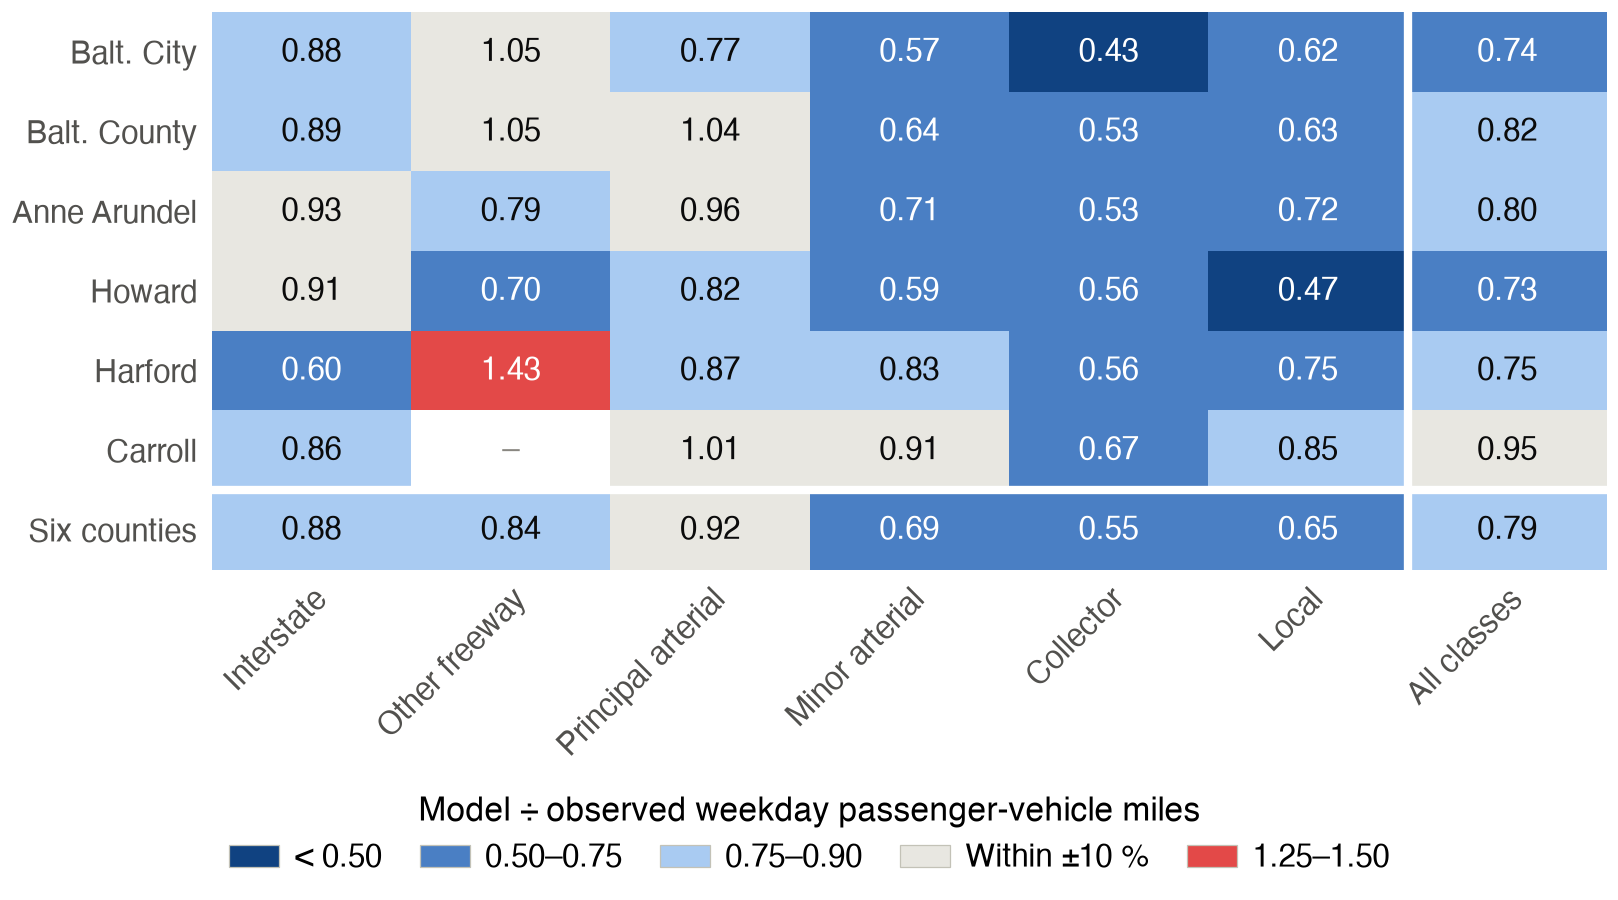
Residents' travel and road traffic
| Home county | By the residents: model | Survey | Ratio | On the roads: model | Observed | Ratio |
|---|---|---|---|---|---|---|
| Baltimore City | 10.7 | 9.5 | 1.13 | 11.5 | 15.4 | 0.74 |
| Baltimore County | 18.3 | 17.8 | 1.03 | 21.3 | 26.0 | 0.82 |
| Anne Arundel | 21.4 | 19.5 | 1.10 | 21.8 | 27.1 | 0.80 |
| Howard | 20.7 | 19.5 | 1.06 | 24.5 | 33.5 | 0.73 |
| Harford | 23.7 | 21.1 | 1.13 | 19.6 | 26.1 | 0.75 |
| Carroll | 25.3 | 24.8 | 1.02 | 19.9 | 21.1 | 0.95 |
| Six counties | 18.7 | 17.3 | 1.08 | 19.5 | 24.7 | 0.79 |
Weekday passenger-vehicle miles per resident, 2024. By the residents: car-driver distance of the executed trips of the county's residents wherever driven, against the travel survey 2017/18 (weighted). On the roads: all modelled car traffic on the network of the county, against the MDOT SHA vehicle miles.
The residents drive slightly more than in the survey, while the traffic on the roads falls short: the gap lies in traffic the model does not carry. The simulated car trips drive 74 % of their route on secondary, tertiary and local roads when start and end lie less than 1 km apart and 14 % when they lie more than 20 km apart. For short trips, 0.2 to 5 km apart, the simulated route is 4 % longer than the fastest route on empty roads and 9 % longer than the shortest route.
Trip lengths
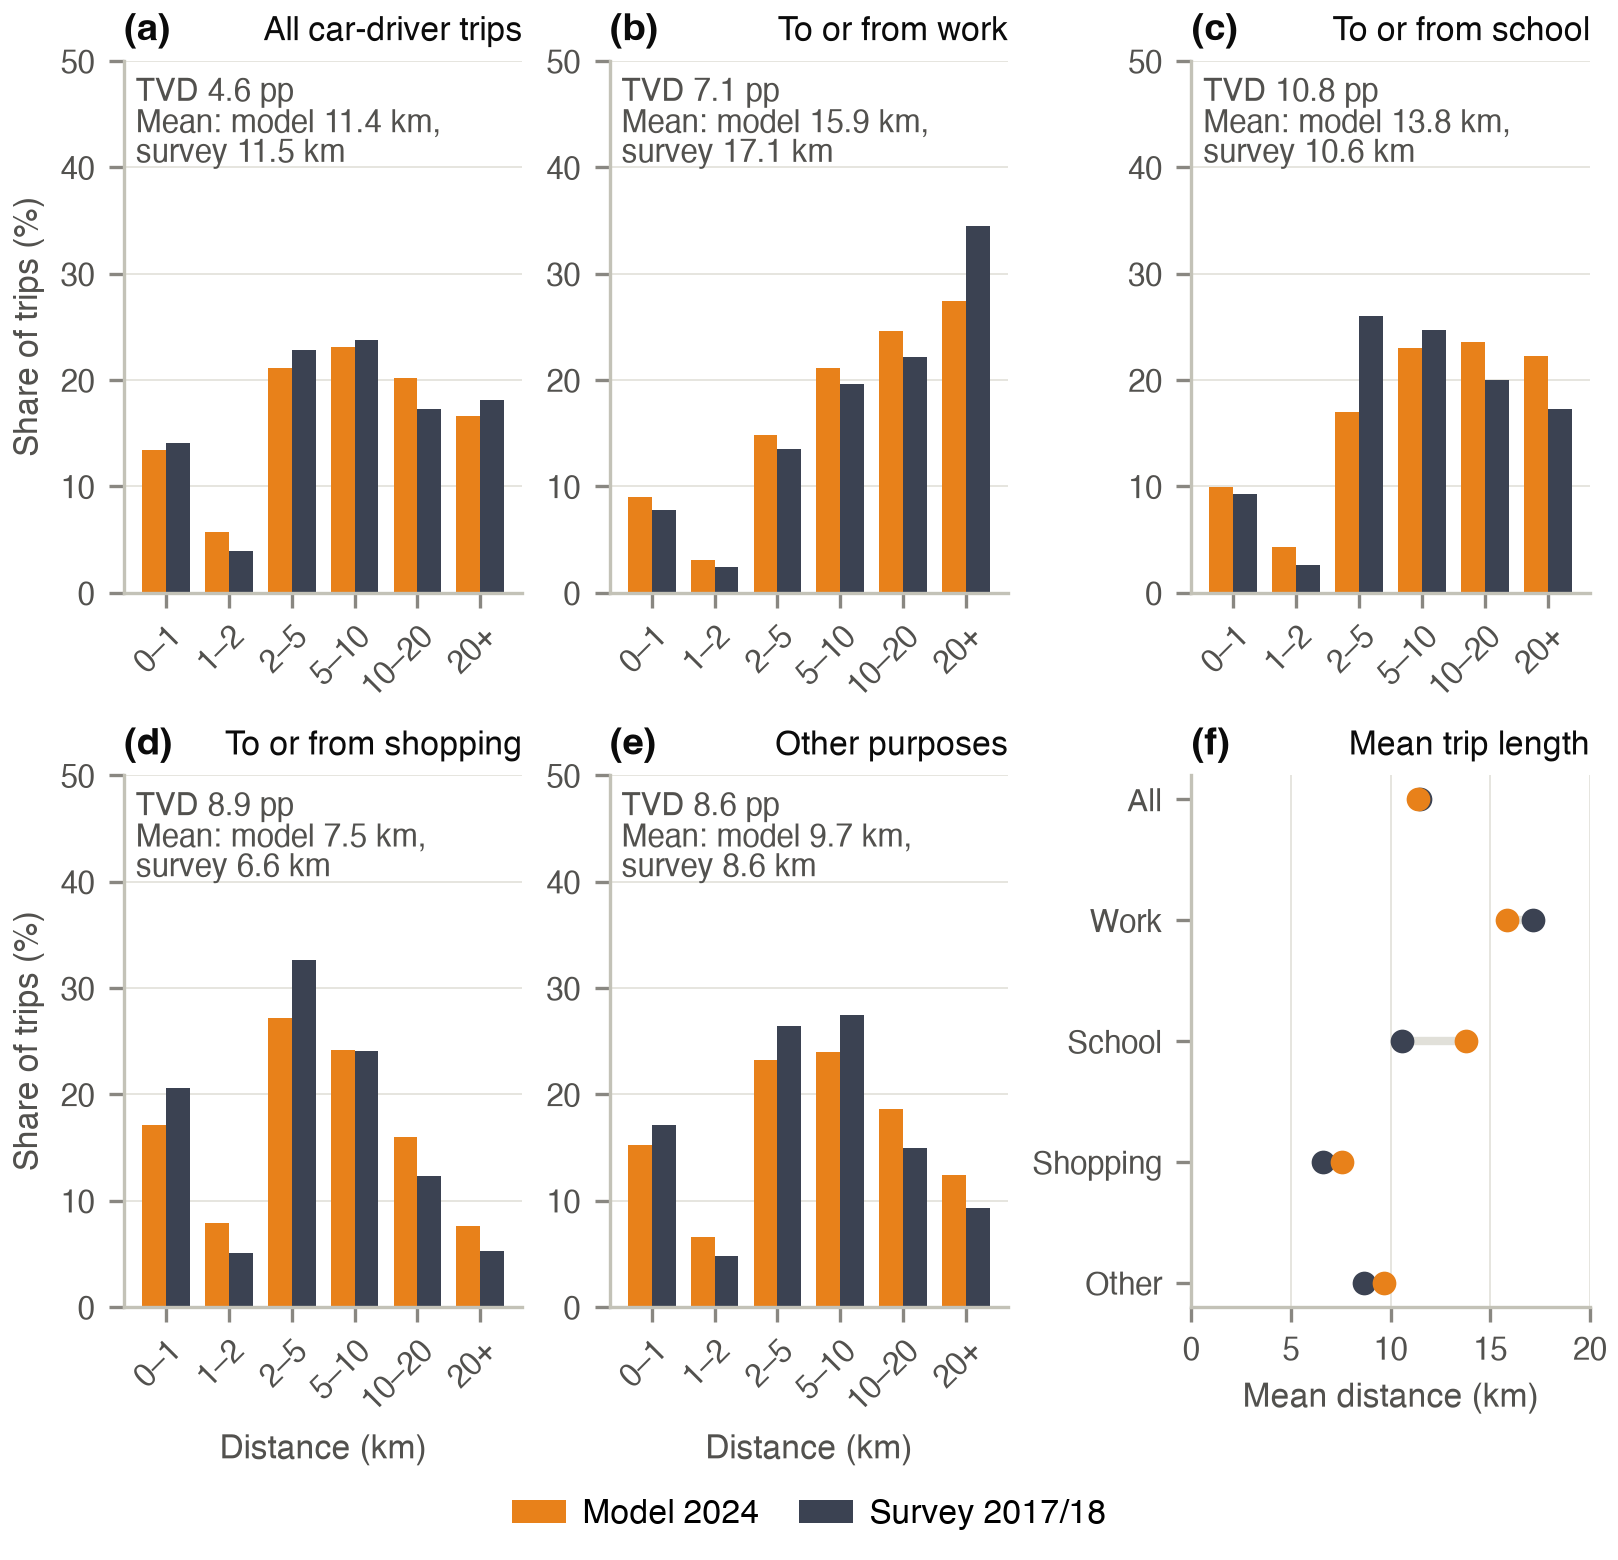
Measured alike, between census tracts, the residents' car-driver trips average 11.4 km against 11.5 km in the survey, with a TVD of 4.6 percentage points; trips to or from shopping are longer than in the survey (7.6 against 6.6 km) and trips to or from work shorter (15.9 against 17.2 km).