School location
Students assigned to schools in every simulated year, against the survey students of the same counties and the ACS enrolment. Model: mean of the five land-use seeds.
| Fit measure in the panel title | Used for | Meaning |
|---|---|---|
| TVD, percentage points | a distribution (the classes add up to 100 %) | share of the students that would have to change class to match the observed |
| MAPE, % | rates, means and counts | mean absolute difference as a percentage of the observed value |
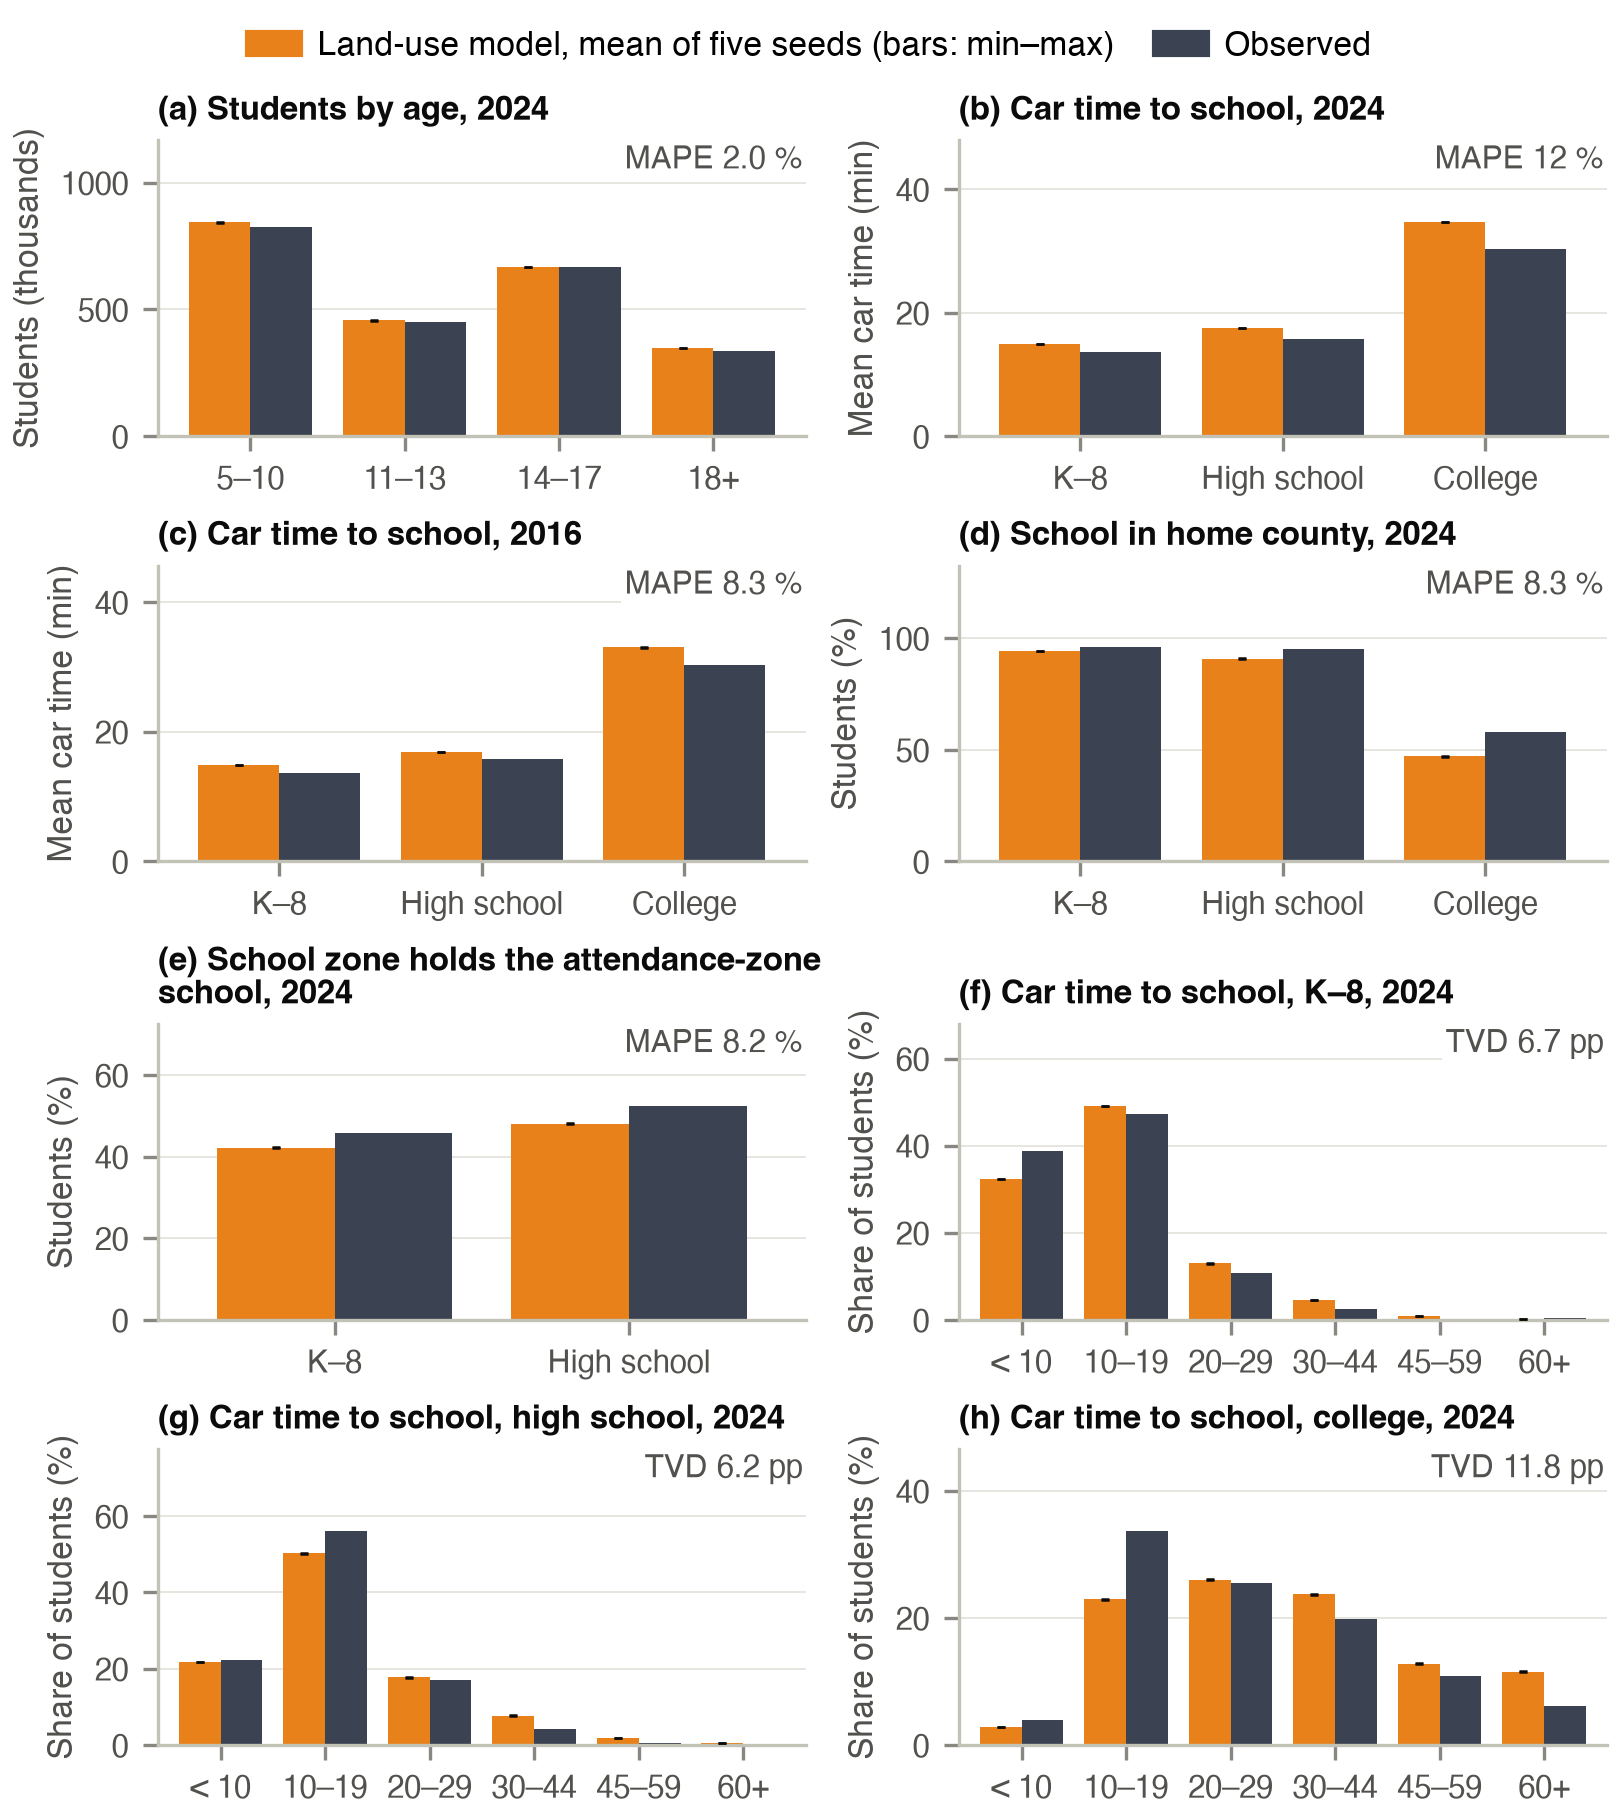
Student numbers are a consistency check, because student status is aligned to the ACS enrolment rates. Model students are restricted to the home counties of the survey students. The attendance-zone share counts homes covered by attendance boundaries.
Why the car time to school is too long
The assigned schools are 1 to 4 minutes farther by car than the schools of the survey students (2024: K–8 14.9 against 13.7 min, high school 17.5 against 15.7, college 34.7 against 30.3), and home-county shares are 2 to 11 points low. Most of the gap is already present in the base year. It grows for high school and college as the population changes while the school inventory and its capacities stay fixed. Enrolment is an upper limit, enforced by shadow prices, so students who do not find a seat at a near school are sent to a farther one. The observed times are those of the 2017/18 survey students, so the 2024 comparison also carries seven years of change in where students live.